TL;DR
- As a Kubernetes cluster grows, a single Prometheus cannot handle all scrape targets, so Prometheus is sharded into multiple instances.
- Once Prometheus is sharded, each shard only has a partial view of the metrics, so recording/alerting rules that need a global view no longer evaluate correctly on individual shards.
- Thanos Ruler evaluates PrometheusRules against Thanos Query, which provides a global view across all shards, and the results can be remote-written to long-term storage.
Sharding Prometheus
A single Prometheus works well for small and medium clusters, but as the number of nodes and pods grows, one instance eventually hits limits on memory, ingestion rate, and the number of scrape targets. The common way to scale beyond this point is to shard Prometheus: run multiple Prometheus instances and split the scrape targets between them.
With Prometheus Operator, sharding is built in. Setting spec.shards makes the operator create multiple StatefulSets, and targets are distributed between shards by hashing the target’s address (__address__) with the hashmod relabel action:
apiVersion: monitoring.coreos.com/v1
kind: Prometheus
metadata:
  name: kube-prometheus
  namespace: monitoring
spec:
  shards: 2 # Prometheus is split into 2 shards
  replicas: 2 # each shard runs 2 replicas for HA
  serviceMonitorSelector:
    matchLabels:
      team: platform
Each shard scrapes only its own subset of targets, so no single Prometheus needs to hold the whole cluster’s metrics anymore. To query across shards, Thanos Query (with Thanos sidecars attached to each Prometheus) fans out the query to every shard and deduplicates the results, providing a single global view:
apiVersion: monitoring.coreos.com/v1
kind: Prometheus
metadata:
  name: kube-prometheus
  namespace: monitoring
spec:
  shards: 2
  thanos: # inject thanos sidecar into each Prometheus pod
    version: v0.39.2
Prometheus Rules with sharding prometheus
Sharding solves the ingestion problem but creates a new one: rule evaluation.
Recording rules and alerting rules are evaluated by each Prometheus instance against its own local TSDB. When Prometheus was a single instance, this was fine — the local TSDB had everything. After sharding, each shard only sees the targets assigned to it.
Consider a simple alerting rule:
apiVersion: monitoring.coreos.com/v1
kind: PrometheusRule
metadata:
  name: node-alerts
  namespace: monitoring
spec:
  groups:
    - name: node.rules
      rules:
        - alert: TooManyNodesDown
          expr: count(up{job="node-exporter"} == 0) > 10
          for: 5m
With 2 shards, each shard evaluates this expression against roughly half of the node-exporter targets. If 12 nodes are down but they happen to be split 6/6 across the shards, neither shard’s count() exceeds 10 and the alert never fires — even though globally the condition is clearly met.
The same problem applies to recording rules that aggregate across the cluster (e.g. sum(rate(container_cpu_usage_seconds_total[5m]))): each shard records only a partial sum, and there is no single series that represents the true cluster-wide value.
In short, any rule whose expression requires a global view breaks silently once Prometheus is sharded. Rules keep evaluating, no errors are reported — the results are just wrong.
Using thanos ruler for sharding prometheus
Thanos Ruler solves this by moving rule evaluation out of the individual Prometheus shards. Instead of evaluating rules against a local TSDB, Thanos Ruler evaluates them against a query endpoint — typically Thanos Query, which already has the deduplicated global view across all shards.
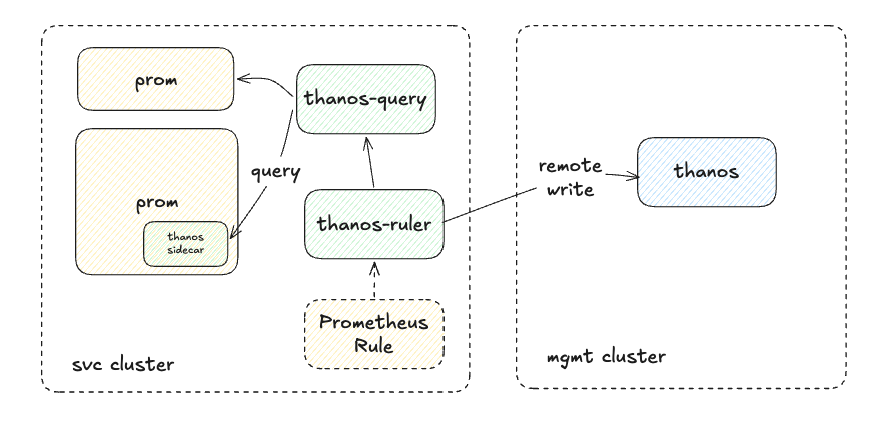
The setup in the diagram works like this:
- Each Prometheus shard in the service cluster runs with a Thanos sidecar.
- Thanos Query fans out to all sidecars and provides a global query view.
- Thanos Ruler loads the PrometheusRule objects and evaluates them against Thanos Query, so every rule expression sees all shards at once.
- The evaluation results (recorded series and ALERTS series) are remote-written to a remote store — Thanos (Receive) in the management cluster as in the diagram, or a Prometheus with remote write receiver enabled (
--web.enable-remote-write-receiver) — for long-term storage and global querying.
With Prometheus Operator, Thanos Ruler is managed by the ThanosRuler CRD:
apiVersion: monitoring.coreos.com/v1
kind: ThanosRuler
metadata:
  name: thanos-ruler
  namespace: monitoring
spec:
  image: quay.io/thanos/thanos:v0.39.2
  replicas: 1
  queryEndpoints:
    - dnssrv+_http._tcp.thanos-query.monitoring.svc.cluster.local # evaluate against thanos-query
  ruleSelector: # select PrometheusRule objects to evaluate
    matchLabels:
      role: global-rules
  remoteWrite: # ship evaluation results to the mgmt cluster
    - url: https://thanos-receive.mgmt.example.com/api/v1/receive
A few points worth noting:
- Rule selection: Thanos Ruler reuses the same
PrometheusRuleCRD that Prometheus uses. By labeling rules and usingruleSelector, you can split rules between the two — rules that only need shard-local data can stay on Prometheus, while rules that need a global view move to Thanos Ruler. - Don’t select the same rules twice: if both Prometheus and Thanos Ruler evaluate the same PrometheusRule, you get duplicate alerts and duplicate recorded series. Make the selectors mutually exclusive.
- Remote write for results: Thanos Ruler stores evaluation results in its own local TSDB, but its retention is short-term. Remote-writing the results to Thanos Receive in the management cluster makes recording rule results durable and queryable alongside all other metrics.
- Reliability trade-off: unlike Prometheus, whose rule evaluation only depends on its local TSDB, Thanos Ruler depends on the network path to Thanos Query. If Thanos Query is down or slow, rule evaluation fails. Keep truly critical alerts (e.g. “Prometheus is down”) on Prometheus itself, and monitor Thanos Ruler with the
thanos_rule_evaluation_with_warnings_totalandprometheus_rule_evaluation_failures_totalmetrics.
Conclusion
Sharding Prometheus is the natural answer to a growing cluster, but it quietly breaks every rule that aggregates across shards. Thanos Ruler restores correct rule evaluation by running rules against the global view of Thanos Query, and remote write ships the results to the management cluster’s Thanos for long-term storage. The key is deciding which rules need the global view — move those to Thanos Ruler, and keep node-local, availability-critical rules on Prometheus where evaluation has the fewest dependencies.